Using it
The report
The sections of the report, the findings and their thresholds, why sessions go wrong, and the exact rules behind ratios and earned titles.
On this page
The report is one HTML file, ~/.ai-insights/reports/report.html. Everything on it is computed from your history without a model, except the parts marked as coming from your agent, which appear only after you run the agent review.
How the page is laid out
- Your cards. The report opens on every recap card you earned, persona first, one large at a time with the whole set beside it. Next to them: your hours, how many agents ran at once at the peak, your totals, and the buttons to publish to the leaderboard or download a video.
- In short. A few sentences on how your weeks went, and your main totals with the change since your last run.
- Publish. The box that builds your share link and takes you to publish to the leaderboard.
- Card studio. The studio, where you pick which cards go into a video, choose a shape and a style, and export them.
- How it actually went. The private analysis, in five numbered parts: Rhythm, How you work, What it cost, What went wrong, and Where your history lives.
- Start with these three. The changes worth making first, ranked, each with its type (Instructions, Feature, Plugin, Habit, Model choice), a copy button for text you can paste, and whether it is new or still open since your last run. More ideas and “Bigger moves” with starter prompts follow.
- Since your last run. Appears from your second run. See below.
How it actually went
01 Rhythm
Messages by hour in your time zone, a calendar of active days, and, under “More detail”, weekdays and how fast you reply to a finished turn. The calendar can show messages, agent time or cost.
02 How you work
Your work ratios and any titles they earned, a “Side by side” timeline of parallel sessions on your busiest days, delegation to other agents, and “Did it work?” once your agent has labelled sessions. More detail covers tool calls by kind, projects by agent time (your home folder shown as ~), MCP servers, skills, thinking and approvals, and the work areas your agent saw.
03 What it cost
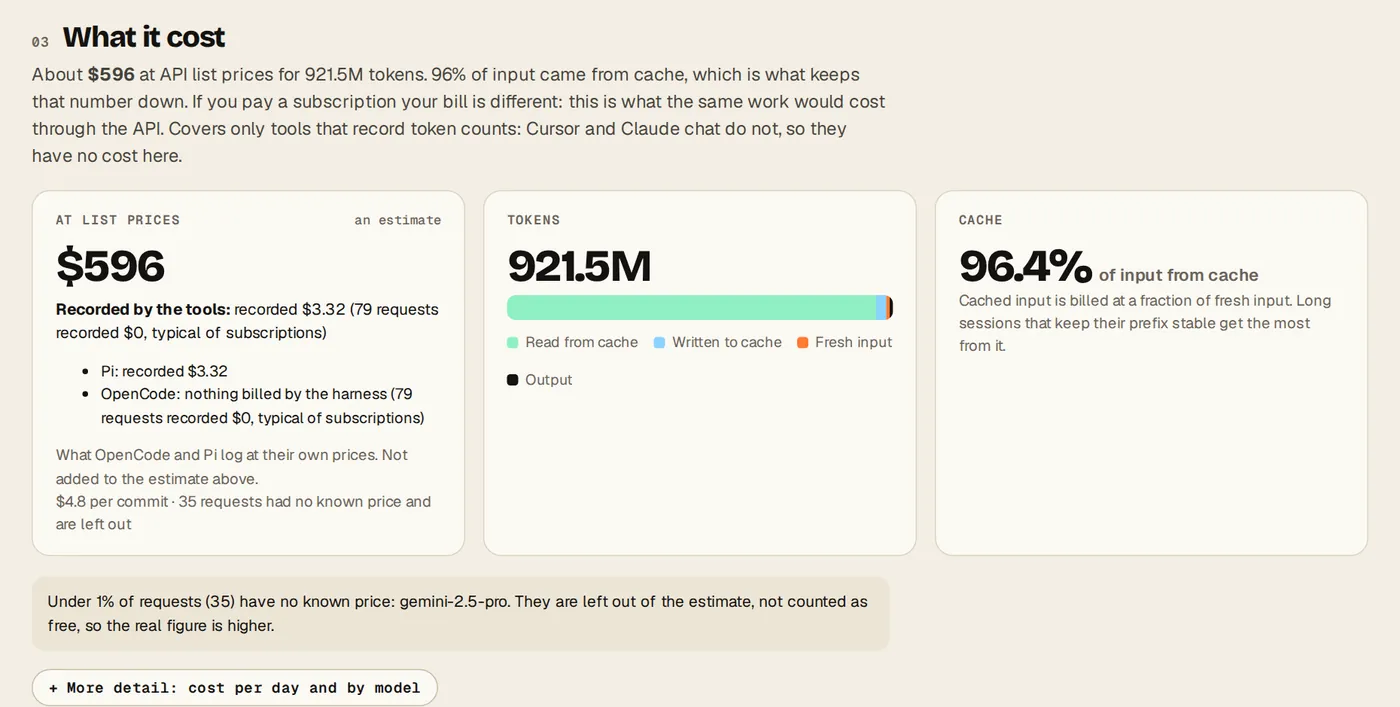
The estimated cost at API list prices, tokens, how much input came from the prompt cache, cost per day and a sortable table by model. See Cost and unpriced models.
04 What went wrong
Why sessions go wrong, why tool calls failed, the programs that failed most, and the findings, filterable by severity.
05 Where your history lives
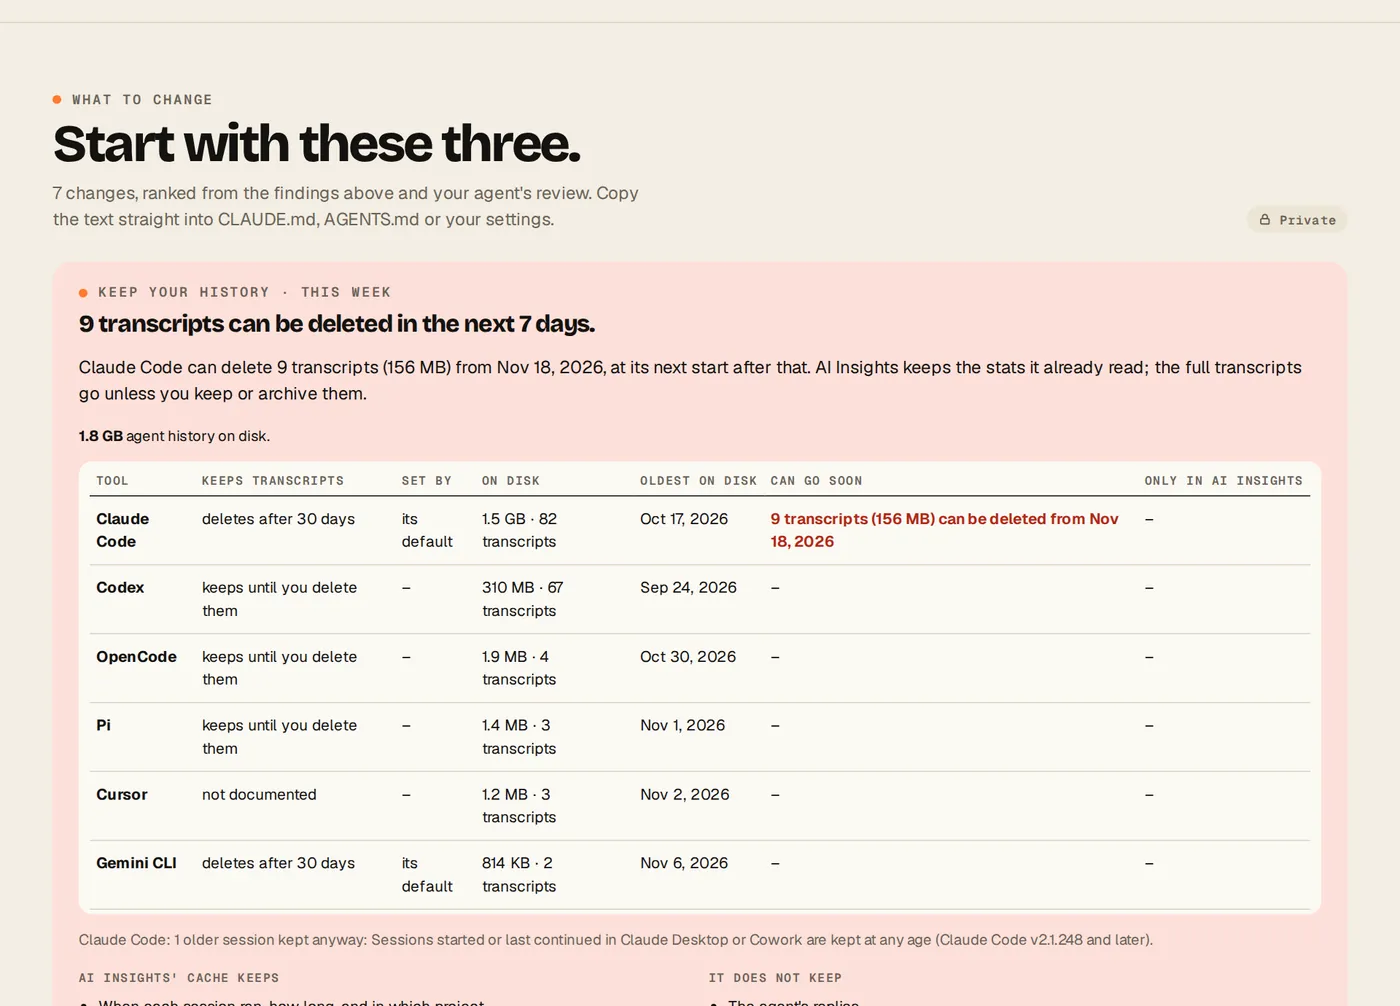
How long each agent keeps its transcripts, how many are due for deletion, and the steps that keep them. See How long agents keep history.
Findings
A finding is a pattern in your history with the evidence behind it: the sessions, the counts and, where it helps, a timestamp your agent can open. Each has a severity (high, medium, low or info), up to 5 pieces of evidence, and a suggestion. A detector that trips over odd data is dropped on its own; it never costs you the whole report. These are all the findings and when they appear:
| Finding | Appears when | Suggestion |
|---|---|---|
| `<command>` keeps failing | The same shell command failed 3 or more times in a row (in 2 or more sessions, or 5 times in one), or it failed in 3 or more sessions at an 80% failure rate or worse. Timeouts count. | Tell the agent how this command should be run |
| You keep telling the agent: “…” | A prompt of 3 to 40 words, or one close to it, was typed in 4 or more sessions on 3 or more different days. | Write it down once |
| Corrections often come late | 3 or more times, in 2 or more sessions you drove, you stepped in after the agent had worked alone for 10 minutes or more. | Agree on the plan before long runs |
| You interrupt the agent a lot | 10 or more prompts sent while the agent was still working, in 3 or more sessions, at 15% of your prompts or more. | Front-load the request |
| Sessions often run out of context | 5 or more context compactions across 3 or more sessions. | Hand off instead of compacting |
| Some sessions run very long | 3 or more sessions with 150 or more active minutes or 80 or more prompts. | Split at natural checkpoints |
| <agent> reads little from the prompt cache | Under 50% of input read from the cache across 1 million or more input tokens, where reaching 80% would have saved $5 or more at list prices. | Keep the cache warm |
| Top-tier models answer quick questions | 8 or more quick sessions (3 prompts or fewer, 5 tool calls or fewer, 10 active minutes or fewer, 20 changed lines or fewer) ran on a top-tier model. | Match the model to the task |
| Code gets committed without a test run | 3 or more sessions, and 25% or more of the sessions that commit, changed 50 or more lines over 3 or more edits and committed without running tests or a type check. | Make checks part of done |
| <agent> keeps asking about the same commands, or keeps hitting permission walls | 10 or more tool calls blocked or refused, across 3 or more sessions, at 1 or more per 100 tool calls. The same safe command blocked 5 or more times in 2 or more sessions is named. | Allow the commands you keep approving, or Tune permissions once |
| <tool> fails <n>% of the time | One tool failed 8 or more times in 20 or more calls, at a 20% error rate or worse, across 2 or more sessions. The suggestion depends on why it failed. | Re-read before editing, Describe the project layout, Stop files changing under the agent, Run long commands differently, Read big files in pieces, or Look at why this tool fails |
| You have not used <feature> | With 10 or more sessions, a feature that would have helped in 2 or more of them was not used: subagents for long exploration, plan mode for big changes, MCP servers for services you call from the shell, skills for long prompts you repeat. | Delegate exploration to a subagent, Start big changes in plan mode, Connect the services you use, Turn your long prompts into skills |
| All of this history is from <agent> | 5 or more sessions, all from one agent. | Compare with a second agent |
| Keep your history | An agent will delete transcripts within 7 days, deletes them at its default age, or your history goes back less than 32 days. | Steps: keep transcripts longer, archive them compactly, keep them across machines |
| Agent history takes <n> MB on disk | The transcripts AI Insights read take 500 MB or more. | Compress and save disk space |
Suggestions of the Instructions type come with text to paste into CLAUDE.md or AGENTS.md. Text with a placeholder such as <n> or an ellipsis is never offered for pasting.
Why sessions go wrong
This panel groups sessions by the kind of trouble they showed. A session counts under every cause it shows a sign of, so the shares can add up to more than 100%. It is a count of sessions, not a diagnosis. It appears once there are 10 sessions; the causes your agent judges appear once it has labelled 10 of them.
| Cause | Signs counted |
|---|---|
| Not enough context given | You typed an instruction you also typed in other sessions, or the agent looked for 2 or more files that were not there. |
| Request misread or unclear | Your agent judged it misunderstood the request. Only the agent review can see this. |
| Context ran out | The session was compacted, or your agent judged context was lost. |
| Tool or environment failures | 3 or more failed tool calls (edits, reads, timeouts; not permissions, missing files or a command's own exit code), the same command failing 3 or more times in a row, or your agent judged a tool, the environment or something outside failed. |
| Permissions and approvals | 2 or more tool calls blocked by permissions, refused at a prompt or stopped by an automatic reviewer, or your agent judged a permission blocked it. |
| Agent went off course | You stepped in while the agent was working (twice, or once after 10 or more minutes alone), or your agent judged it took a wrong approach, ignored instructions, over-engineered, wrote buggy code, left the work incomplete, or was slow or stuck. |
Each cause shows its signs, up to two sessions as evidence, and a fix: the matching finding's suggestion when there is one.
Work ratios
Five ratios describe how you work. None grows by spending more tokens, and each shows the counts behind it under “What each ratio counts”. A session “you drove” is one where you typed and no other agent sent more messages than you.
| Ratio | What it counts |
|---|---|
| Mid-run corrections | Prompts you sent while the agent was still working on its turn, per session you drove. |
| Sessions that hit a context reset | Sessions compacted at least once because the conversation outgrew the context window, out of all sessions. |
| Tool-call error rate | Tool calls that came back with an error (a failed command, a missing file, a refusal), out of all tool calls. |
| Started with a plan | Sessions you drove that changed files and began from plan mode, a plan step before the first edit, or a written brief, out of sessions you drove that changed files. |
| Sessions running at once | Active time summed over every session, divided by the clock time when at least one was active. 2× means two at once on average. |
Earned titles
Titles come from the ratios with fixed rules, so the same numbers always earn the same titles. Each pair names two ways of working, both fine. A ratio needs enough data before it can earn anything, earns at most one title, and you hold at most three. Rules are checked in this order:
| Title | Earned when | Needs at least |
|---|---|---|
| The Clear Briefer | 0.10 or fewer mid-run corrections per session | 10 sessions you drove |
| The Hands-On Pilot | 1 or more mid-run corrections per session | 10 sessions you drove |
| The Architect | Half or more of the sessions that edited files started with a plan | 10 sessions that edited files |
| The Improviser | 10% or fewer of the sessions that edited files started with a plan | 10 sessions that edited files |
| The Conductor | 2 or more sessions running at once on average | 5 clock hours |
| The Deep Focuser | 1.1 or fewer sessions running at once on average | 5 clock hours |
| The Context Keeper | 5% or fewer of sessions hit a context reset | 10 sessions |
| The Deep Diver | 30% or more of sessions hit a context reset | 10 sessions |
| The Smooth Operator | 3% or fewer of tool calls failed | 200 tool calls |
| The Stress Tester | 15% or more of tool calls failed | 200 tool calls |
Titles appear in the report, on a “Titles earned” card, and, if you publish, on your profile.
Persona
The persona card names you from two rules over your numbers. No model is involved.
- The time word comes from when you prompt: Night when 20% or more of your prompts fall between 22:00 and 04:59 and under 5% between 05:00 and 09:59; Dawn when 20% or more fall between 05:00 and 09:59; otherwise by your busiest hour: Golden-Hour from 17:00, Afternoon from 12:00, Morning before that.
- The role is Orchestrator when 5 or more agents ran at once or your sessions averaged one subagent or more each; Shipper when 40% or more of your sessions ended in a commit; otherwise Delegator.
So you might be The Night Orchestrator or The Morning Shipper. When your agent has labelled sessions, the reason line adds how many hit their goal.
Cost and unpriced models
Cost is an estimate: tokens times the public API list price of each model at the time of each request, from a pricing table built into the package (the report names its version). It is not what you paid. On a subscription or a coding plan your real spend is different.
- Models without an exact entry in the table are unpriced: they are left out of the estimate and counted, rather than given a guessed price. The report says what share of requests was unpriced.
- Where an agent records its own cost per request, the report shows that recorded spend separately. A recorded $0 usually means a subscription, not free use.
- Cursor sessions have no token counts, so they add no cost.
Since your last run
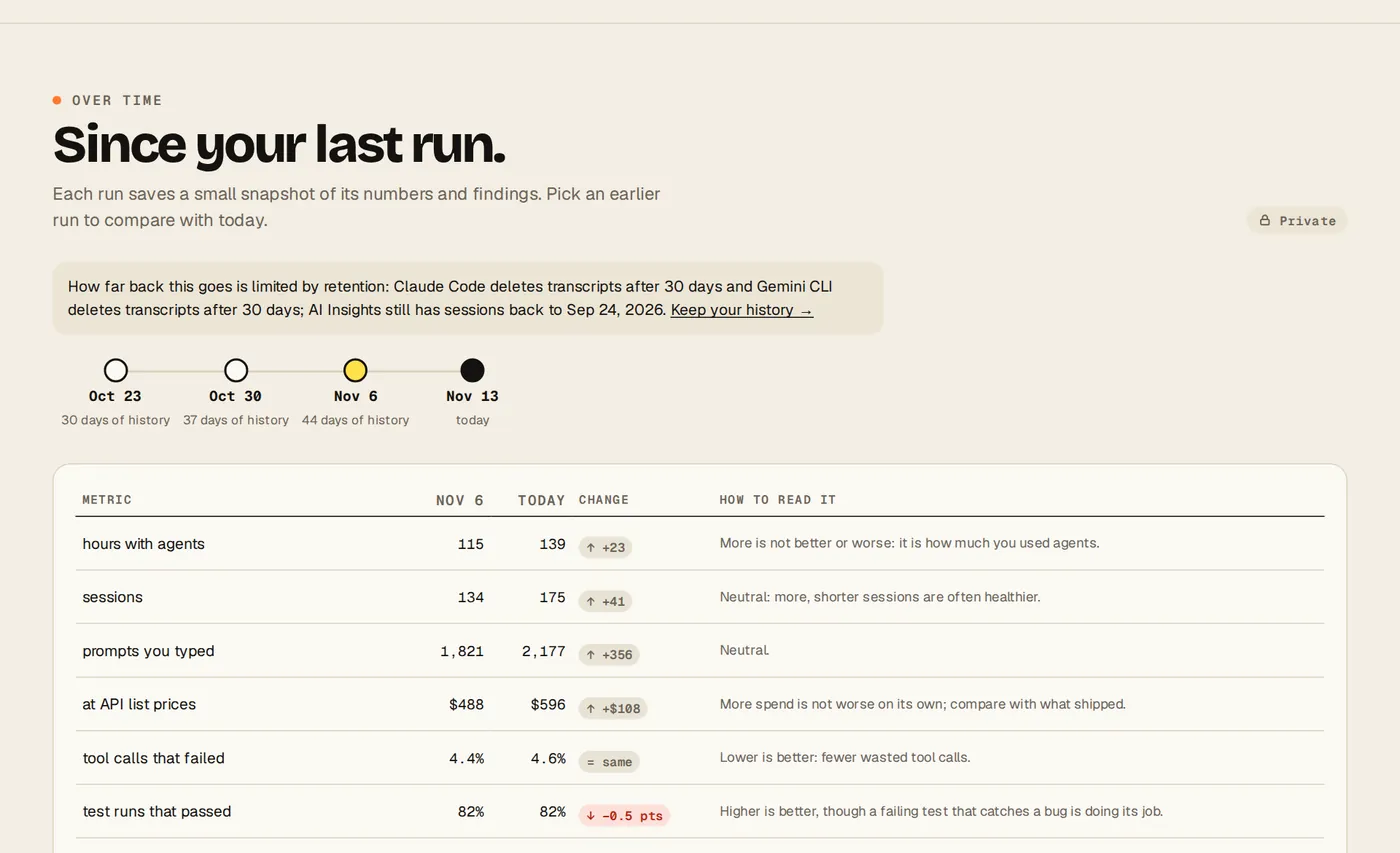
Every run saves a small snapshot in ~/.ai-insights/snapshots/. Two runs within 10 minutes of each other count as one; the later replaces the earlier. From your second run the report shows:
- a timeline of your runs, with how many days of history each covered;
- trends across runs: failed tool calls, passing test runs, compactions per session, input read from cache, cost and prompts;
- findings since the previous run, grouped as looks resolved, still open, and new.