Using it
Recap cards
The animated recap cards, reading them at the top of the report, their three styles and four shapes, the card studio, and exporting video and images.
On this page
The report opens on your recap: animated cards you can post, built only from counts, dates, allowlisted words and public program, model and agent names. Your prompts, file and project names, paths and session ids never appear on a card, and the private analysis never reaches one.
The cards
There are 21 standard cards and 4 more that are offered when your history has the data. A card only appears when there is something true to show. The id is what you use in the cards URL option.
| Card id | What it shows |
|---|---|
intro | Opens the recap: your last N days with AI, your agents and your busy days, one square per day. |
hours | Time with agents: clock hours and agent-hours. |
clock | When you prompt, and whether you are a night owl, an early bird or a daytime builder. |
weekday | Your busiest day of the week. |
streak | Your longest run of days in a row. |
words | Words you typed, your favourite word and how many prompts were questions. |
manners | Your pleases, thank-yous and sorries. |
slash | The slash commands you use most. |
shell | Bash hall of fame: the programs your agents ran most. |
tests | Test runs and how many passed. |
danger | Living dangerously: rm -rf, force pushes and naps. |
parallel | The most agents you ran at once. |
marathon | Your longest session. |
failures | Where things broke: failed tool calls by kind. |
nemesis | The programs that failed most often. |
model | Your top model. |
tokens | Tokens processed and the estimated cost. |
persona | Your persona, from fixed rules over your numbers. |
tips | Three things to try next, from your findings. |
summary | Everything on one card. |
outro | How to make your own. |
thinking | Deep thoughts: thinking blocks. Offered with 10 or more. |
approvals | Rubber stamp: actions approved automatically and by hand. Offered when both are recorded. |
history | History kept: how many days of history AI Insights holds. Offered when retention data exists. |
titles | Titles earned. Offered when you earned at least one. |
A new recap starts with persona, parallel, danger, manners, words and clock, then summary and outro: about 54 seconds, which fits Stories, Reels and X without a warning. Cost stays off by default; add the tokens card if you want it.
Styles and shapes
- Three styles: Pop (the default), Instrument panel and Sticker sheet. Switch them at the top of the report.
- Four shapes: 1:1, 9:16, 4:5 and 16:9. Each card is laid out again for the shape rather than cropped.
- The mark: every card carries “AI Insights by Matrix OS” by default. The “AI Insights mark” switch in the studio turns it off.
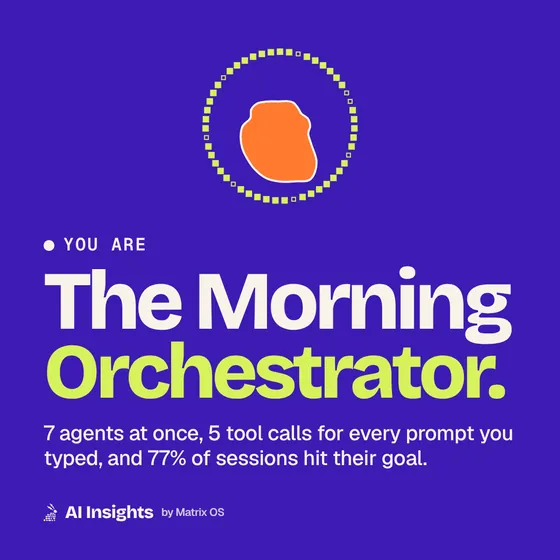
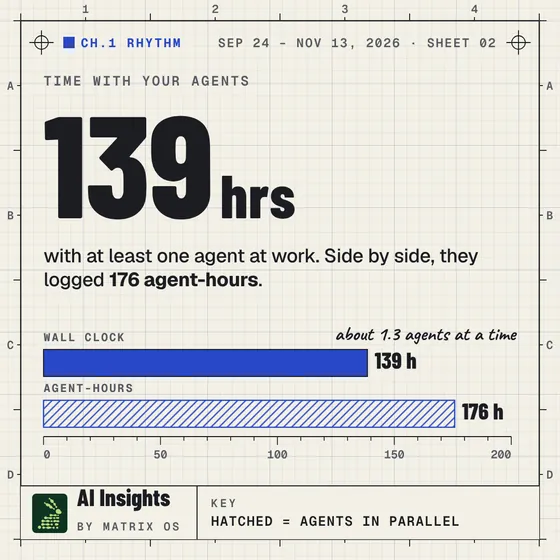
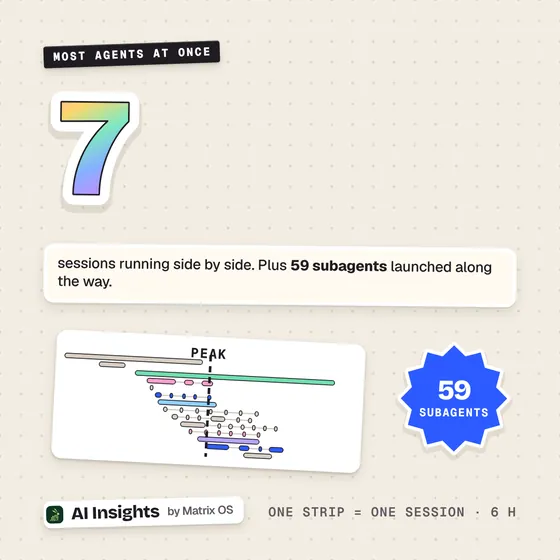
Pop, Instrument panel and Sticker sheet, from the sample report (invented sessions).
Reading your cards
The top of the report shows every card you earned, persona first, then the ones people talk about most, with the summary and the closing card last. One card is shown large and plays its animation; a grid of all of them sits beside it (a strip under it on a phone).
- Move between cards with the arrow buttons, the left and right arrow keys, a swipe, or by picking one in the grid. The cards play on their own until you move; then the card you picked stays.
- Full screen plays the whole set. With reduced motion turned on in your system, cards are shown at rest and do not play on their own.
- Browsing does not change your video. The studio decides which cards go into the video, and your share link is the same whichever card you look at.
The card studio
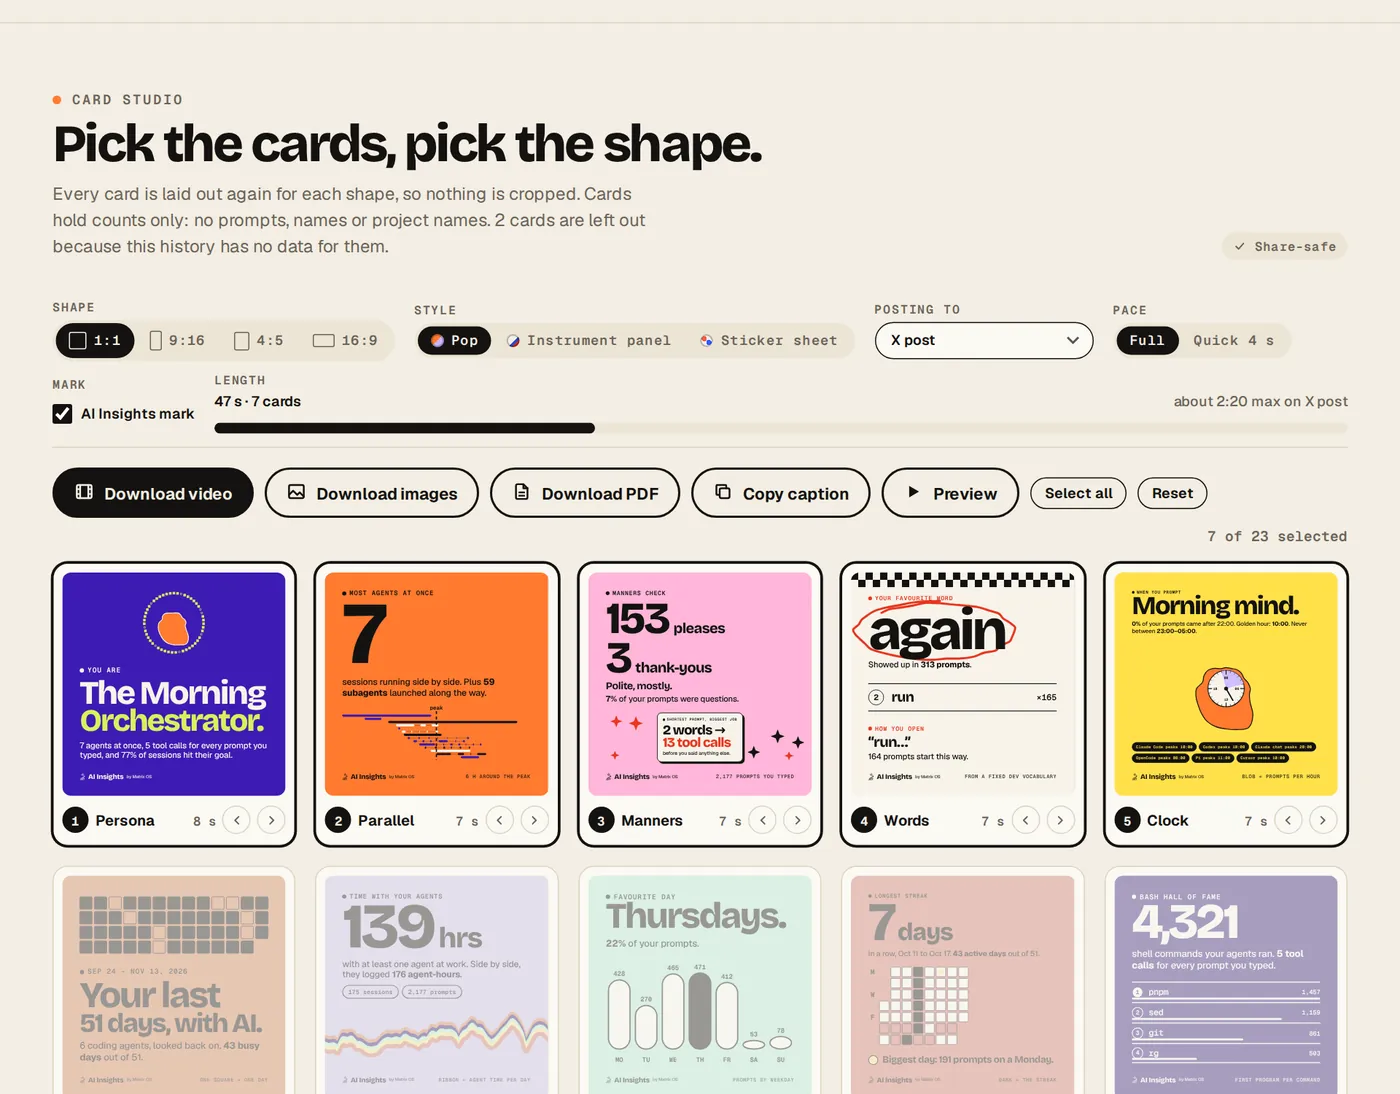
Further down the report, after the Publish section, the studio has everything for making a post:
- Pick and order cards. Click a card to include or leave it out. Drag it, use its arrow buttons, or press Alt with the left or right arrow key to move it. Select all and Reset are next to the export buttons.
- Where you will post. Choose X, Instagram feed, Instagram Reels, Instagram Stories, TikTok, LinkedIn, LinkedIn carousel (PDF) or YouTube Shorts. The studio checks the total length against that platform's limit and recommends a shape; for the carousel it counts pages instead (see Post to LinkedIn).
- Pace. Full plays each card at its own length; Quick caps every card at 4 seconds.
- Preview plays the selection.
The studio remembers your choices in the browser for the next time you open a report.
Export video, images and PDF
- Download video renders an MP4 of the selected cards in the page. It needs a browser with the WebCodecs video encoder, which today means Chromium-based browsers such as Chrome, Edge, Brave and Arc. Other browsers get the terminal recipe instead.
- Download images saves a PNG of each selected card; several come as one zip.
- Download PDF saves the selected cards as one square PDF, one card per page, for a LinkedIn carousel.
- Copy caption copies the post text described under Share buttons.
Nothing is uploaded: the files are made in the page and saved by your browser.
Post to LinkedIn
LinkedIn shows a PDF in a post as slides people swipe through. In the studio, set Posting to to LinkedIn carousel (PDF): the shape switches to square, the length bar counts pages, and Download PDF becomes the main button. It saves ai-insights-linkedin.pdf with your selected cards in the studio's order, each at rest (the last frame of its animation), in the style you picked and with the AI Insights mark if it is on. The file's only metadata is the title “AI Insights recap”.
- In LinkedIn, press Start a post, then More and Add a document.
- Choose the PDF, give the document a title and press Done.
- Paste the caption (Copy caption in the studio gives a LinkedIn version) and press Post.
LinkedIn takes documents of up to 300 pages and 100 MB (Upload and share documents on LinkedIn). A full deck of 23 cards is about 6 MB. The plain LinkedIn target is still there for posting the video.
Render in a terminal
When the browser cannot encode video, the studio shows a shell script that takes headless screenshots of each card frame by frame and stitches them with ffmpeg. It needs Chrome or Chromium and ffmpeg, runs in the folder that holds report.html, and takes a few minutes. The script is generated for your current selection, shape and style, so copy it from the report rather than from here.
Each frame is the report opened in capture mode, report.html?capture=<card>&t=<ms>, which draws one card at one moment, so the video matches what you see in the page.
Share buttons
After an export, a “Share it” row appears under it. Each button is a link you click; the page itself sends nothing.
- Share… opens your system share sheet with the files and the caption, where the browser can share files (mostly phones).
- X opens a new post with the caption. A single image is copied to your clipboard to paste in; otherwise the file is saved for you to attach.
- LinkedIn saves the file and opens a new post with the caption.
- Instagram and TikTok / Shorts save the file and copy the caption, since those apps take uploads only.
- Download and Copy caption do just that.
The caption is built from the recap only: your persona, two or three of your biggest numbers, how to make your own, and #MyAIInsights, kept under X's 280 characters.
The “Share your stats and cards” box in the Publish section, just above the studio, makes a link to your card on the website instead. That is covered in Share links.
Report URL options
You can set the studio from the report's address, after ? or #. Options in the URL win over what the browser remembered.
| Option | Values | Effect |
|---|---|---|
style | pop, panel, sticker | The card style. |
ratio | 1:1, 9:16, 4:5, 16:9 | The card shape. |
cards | Card ids, comma-separated | Selects those cards, in that order. |
mark | 0 | Hides the AI Insights mark. |
report.html?style=sticker&ratio=9:16&cards=persona,parallel,streak,summary,outro